Tuesday, November 10, 2015

Statistical modeling

Problem:


Solution:

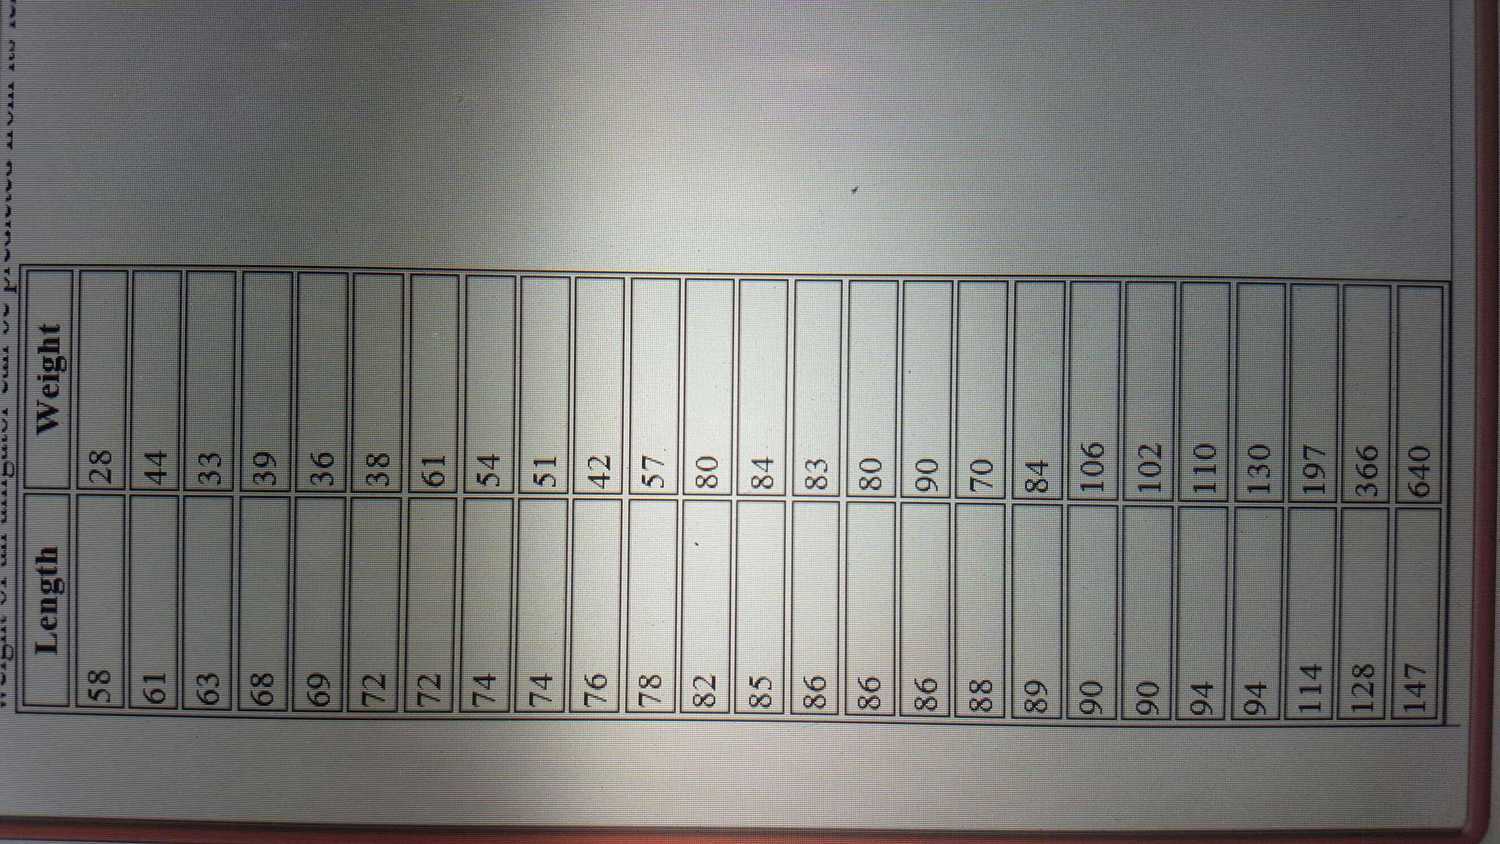
First, let make a raw plot


It looks like power law, let's take a look at the log-log plot


So it make sense, as weight should proportional to volume proportional to length cube. Let's do a cubic model


Notice I purposefully set the y-intercept of the regression line to be 0.


Another parabola

Problem:


Solution:

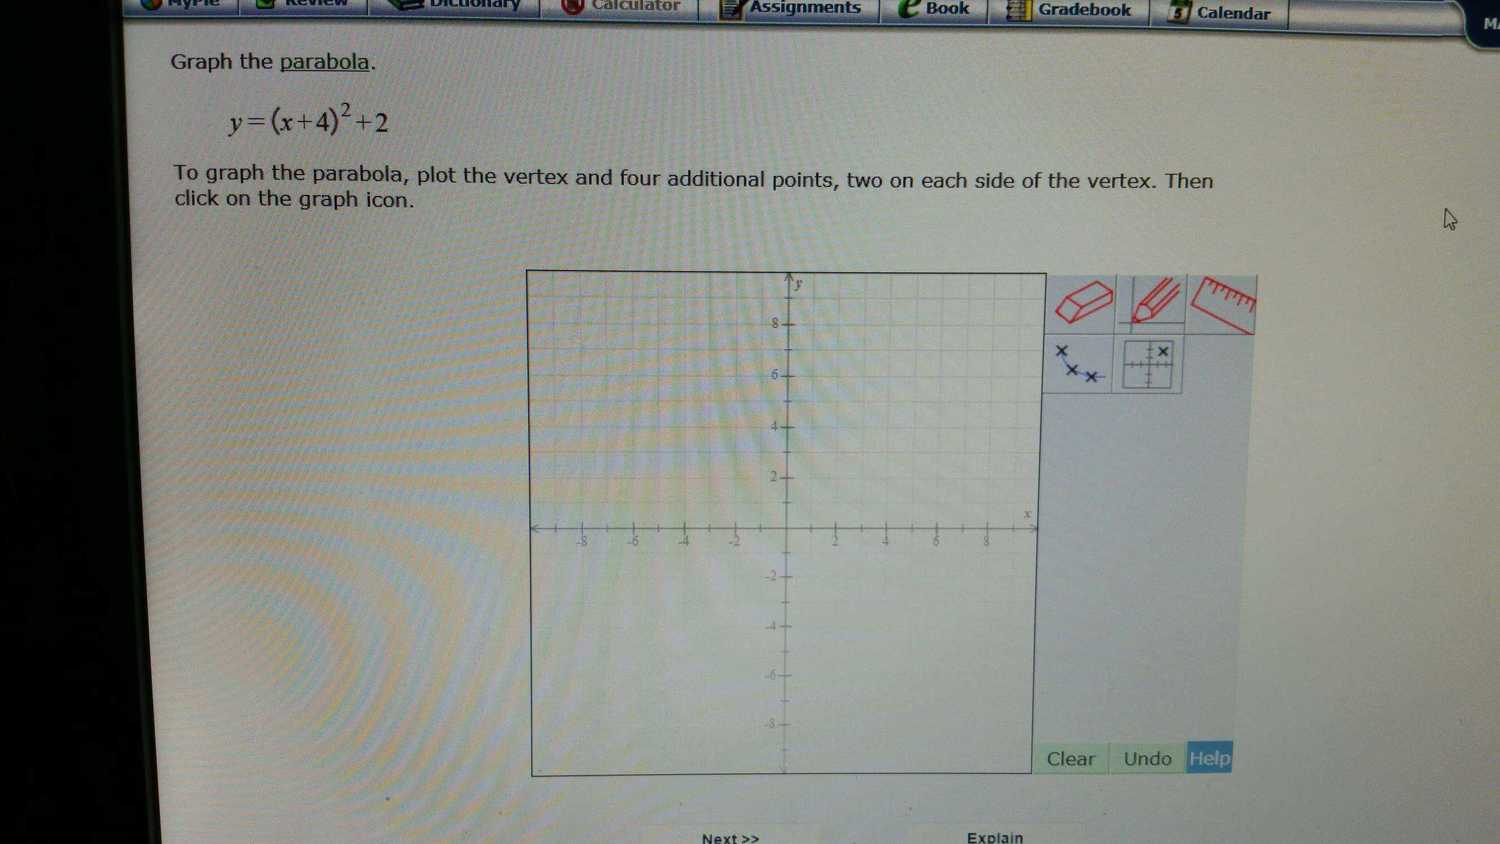
These are the point I used to plot the parabola.

(-6, 6)
(-5, 3)
(-4, 2)
(-3, 3)
(-2, 6)

And here is the plot:


Monday, November 9, 2015

Plot yet another parabola

Problem:


Solution:

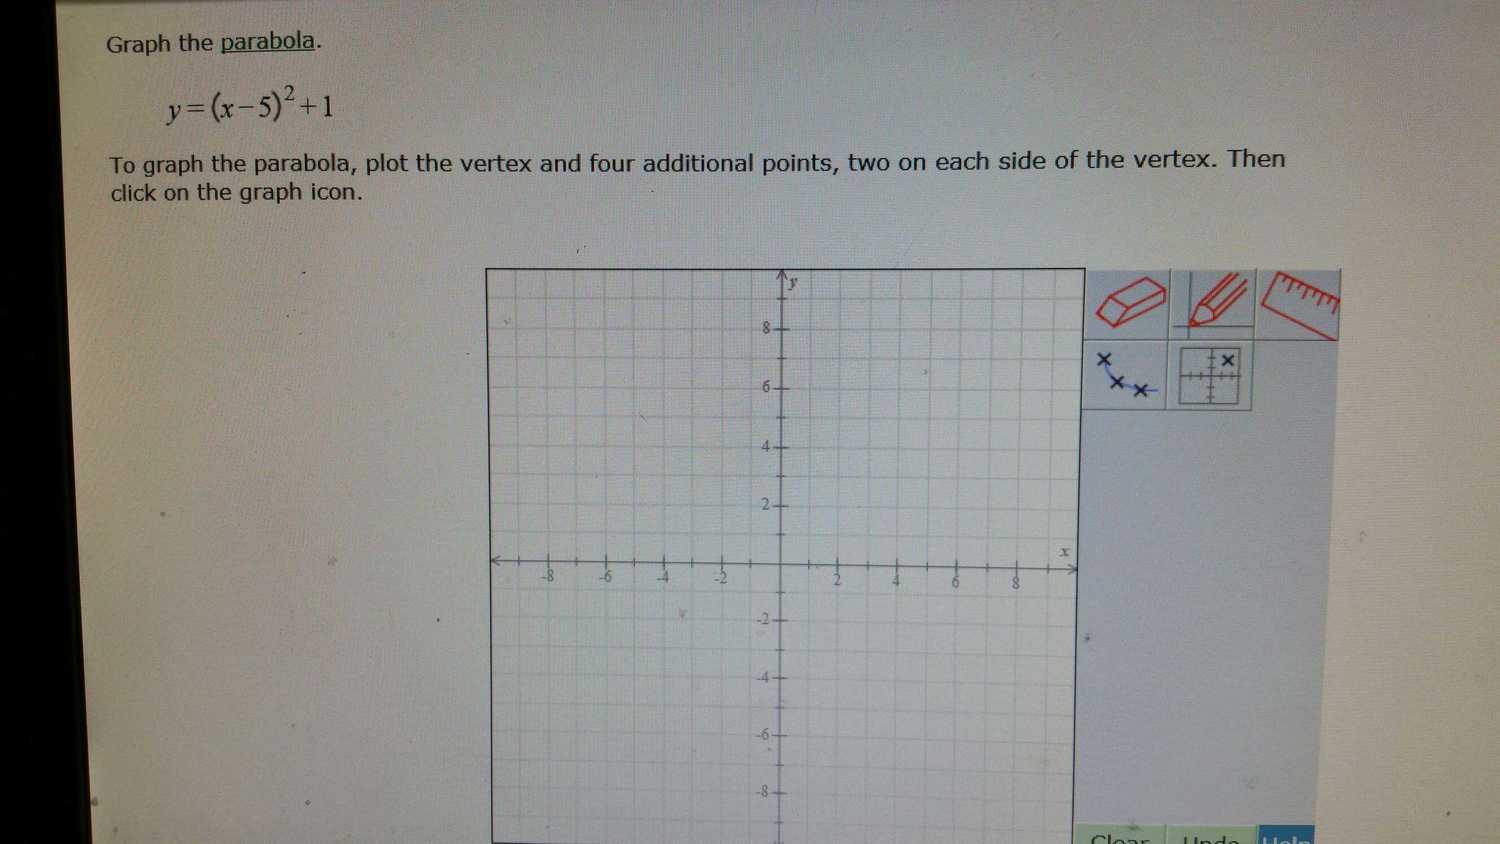
These are the point I used to plot the parabola.

(3, 5)
(4, 2)
(5, 1)
(6, 2)
(7, 5)

And here is the plot:


Mechanics

Problems:


Solution:

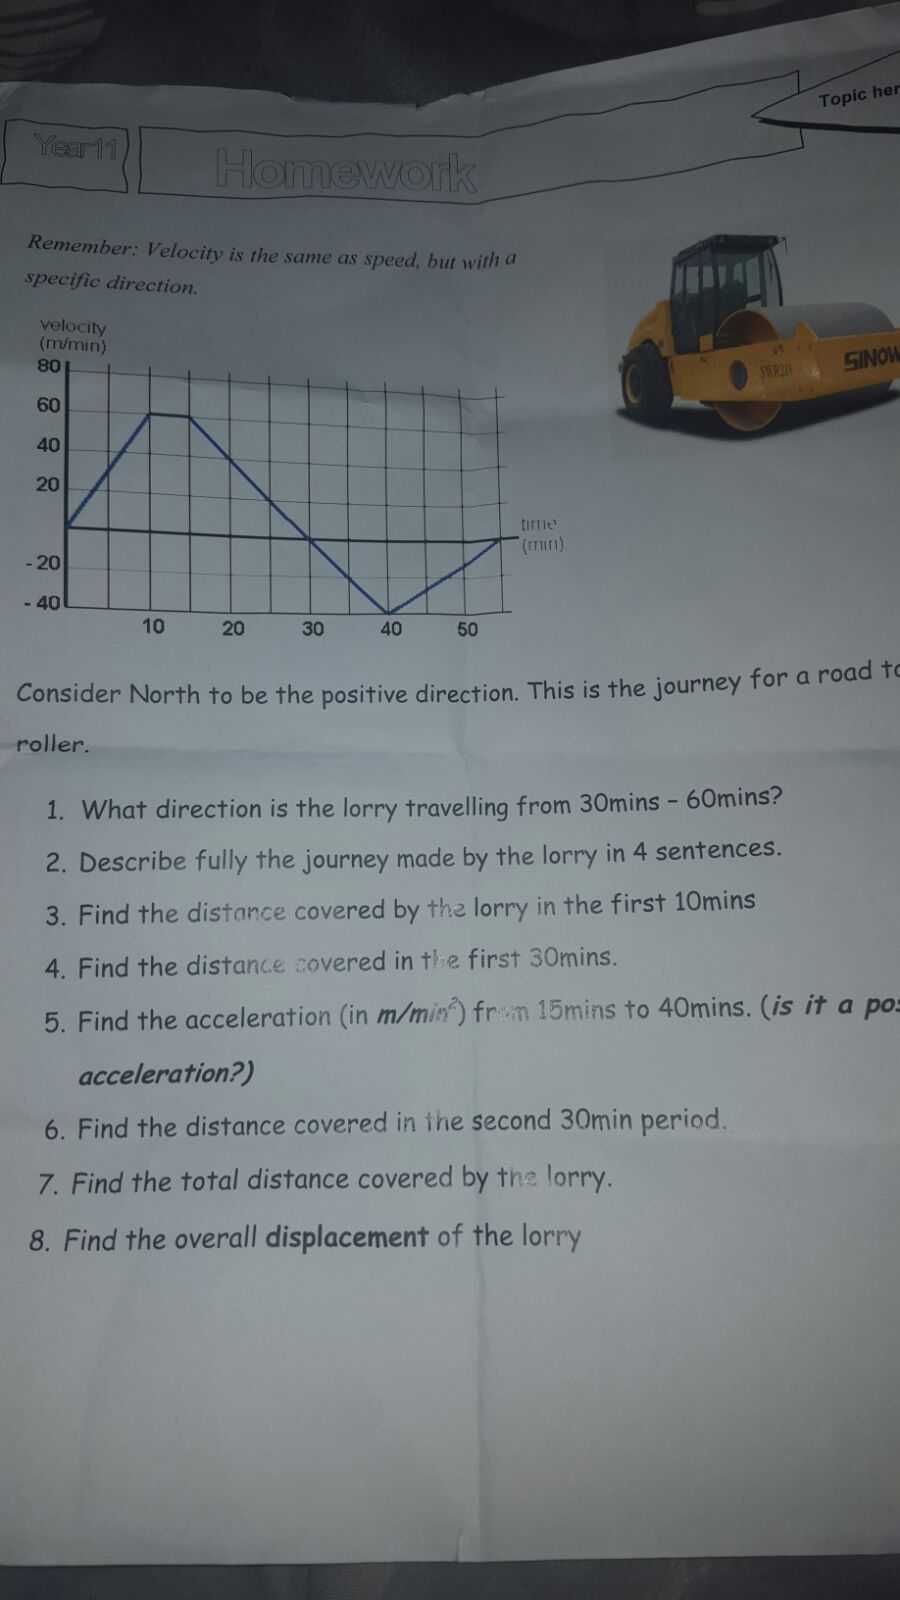
1.) It is traveling towards South.

2.1) It accelerated towards North from 0 minutes to 10 minutes
2.2) It maintained constant speed towards North from 10 minutes to 15 minutes.
2.3) It decelerates and eventually stop from 15 minutes to 30 minutes.
2.4) It accelerated towards South from 30 minutes to 40 minutes.
2.5) It decelerated towards South eventually stop from 40 minutes to 55 minutes.

3.) 300 meters

4.) 1,050 meters

5.) -4 meter per second squared

6.) 500 meters

7.) 1,550 meters

8.) 550 meters

Sunday, November 8, 2015

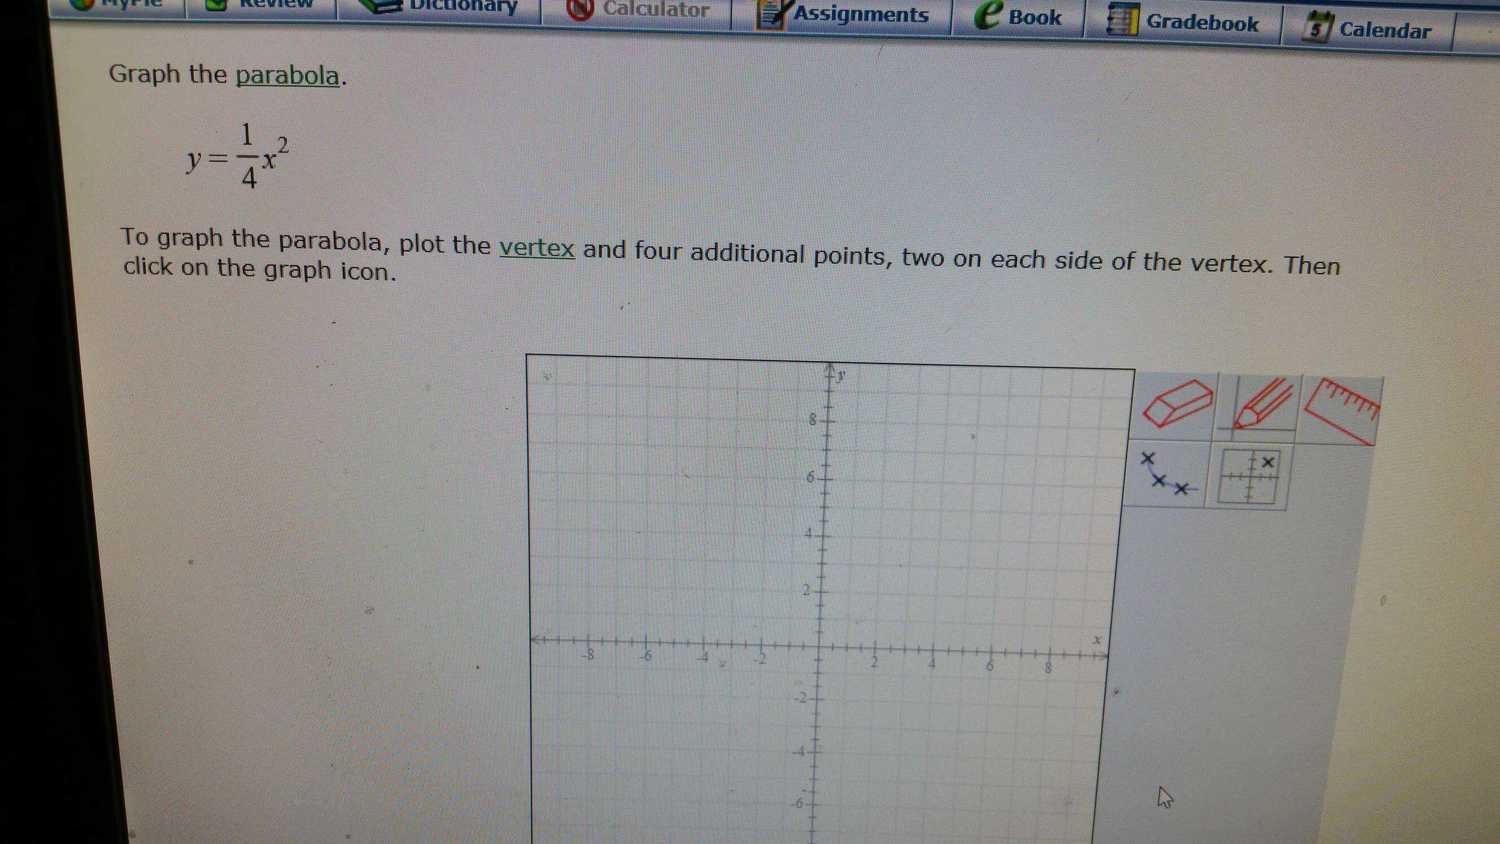
Plot another parabola

Problem:


Solution:

These are the point I used to plot the parabola.

(-2, 1)
(-1, 0.25)
(0, 0)
(1, 0.25)
(2, 1)

And here is the plot:


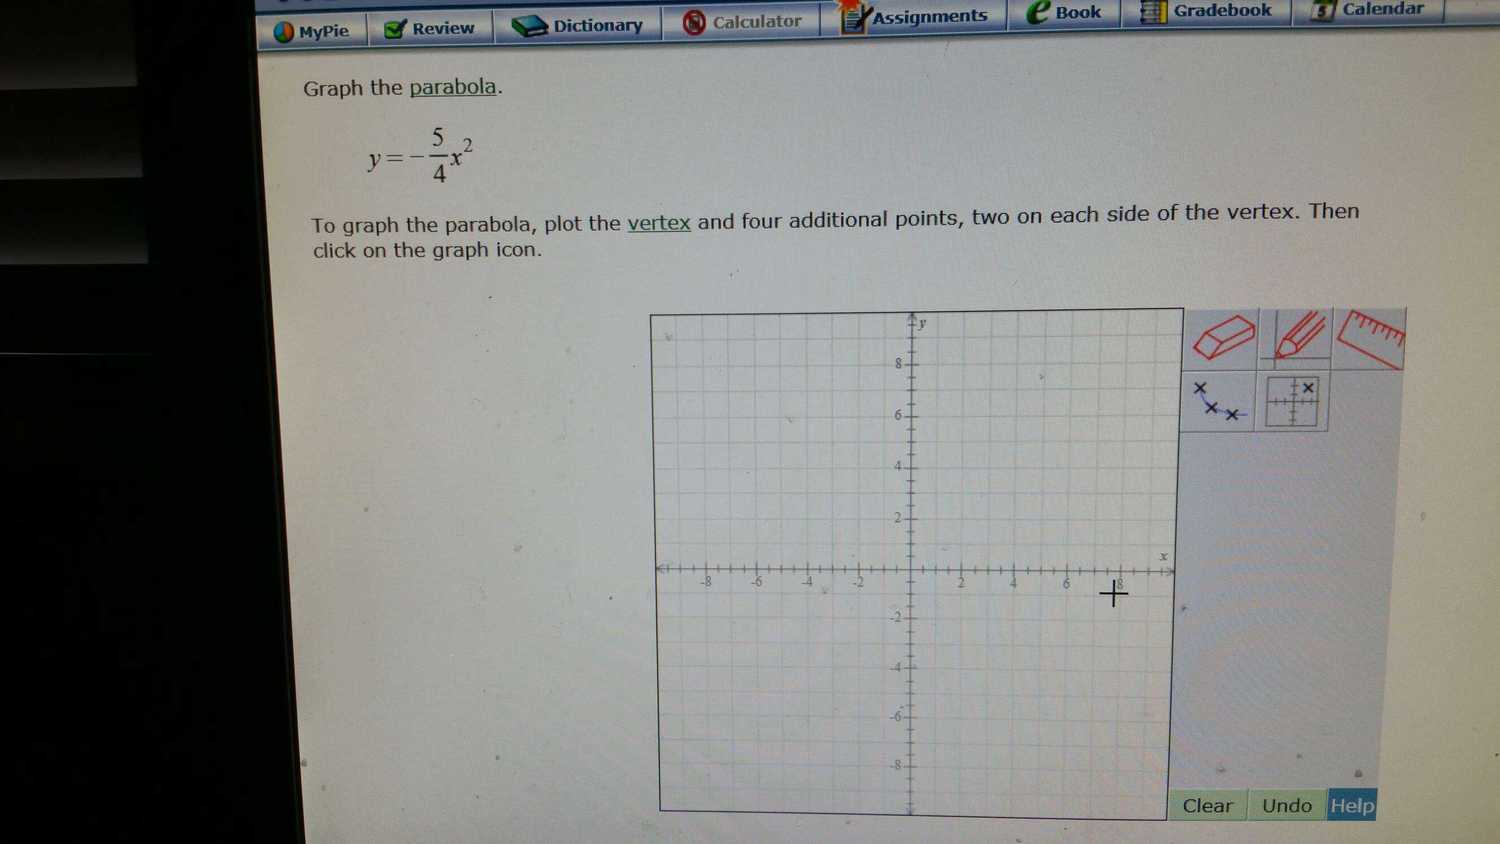
Plot parabola

Problem:


Solution:

These are the point I used to plot the parabola.

(-2, -5)
(-1, -1.25)
(0, 0)
(1, -1.25)
(2, -5)

And here is the plot:


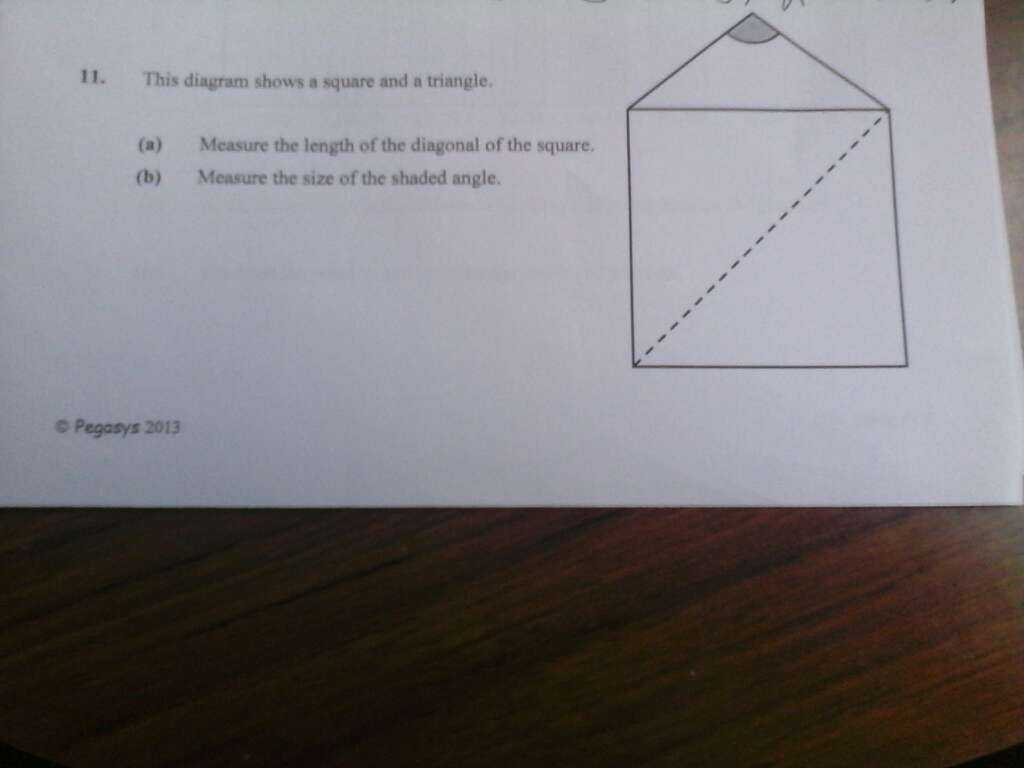
Measure

Problem:


Solution:

You have to do the problem yourself, but I can tell you how exactly you will want to do it.

Step 1: You have to get yourself a ruler and a protractor, if you don't have one already, try to get your mom/dad to buy one for you, or if you are in a hurry, borrow from a classmate.


Step 2: To measure the length of the diagonal, place the ruler on the diagonal. Place to zero mark to the lower left end of the diagonal. Do it exactly as shown.


Step 3: To read the answer, now focus on the part in the diagram above I marked read here. Count the smallest big number of the left hand side and then the number of small fringes. As an example, it may look like this


If you followed all the steps, you should have the answer now, write it down.

Step 4: To measure an angle, you place a protractor you place the middle point of the protractor at the vertex of the angle, and the 0 degree line on the right hand side edge. Do it exactly as shown


Step 5: To read the final answer, now focus on the part of the diagram about I marked as read here again. Count the smallest big number of the left hand side and then the number of small fringes. As an example, it may look like this


Now you should be able to write down the final answer!